![]() Maurice Kherlakian
Maurice Kherlakian
Why We Chose ClickHouse to Improve Our User-Facing Analytics Performance of 1B+ Rows
When we started Hookdeck, we made heavy use of PostgreSQL for all storage and data retrieval aspects. That served us well because PostgreSQL is extremely versatile and possesses a vast, rich ecosystem of tools and libraries. Ultimately, it allowed us to build features quickly and efficiently.
However, as our data volume grew larger, some of our tables had well over a billion rows. That made read workloads quite slow, which impacted our users. Some queries, such as the histogram in our dashboard, were taking over 30 seconds to run. Indexes help, but with over 10 dimensions it's impossible to create them with all possible permutations.
So we started looking for solutions…
Enter ClickHouse
We set out to test a few data stores, and the leading ones turned out to be Elasticsearch and ClickHouse (though we also tested MongoDB, Sneller, and Spark/Hadoop). In the end, we decided to use ClickHouse based on the following benefits:
- Compression: ClickHouse's columnar storage allows for effective data compression; compared to our PG tables (total size with indexes), our ClickHouse tables take up ~1/10th of the space (400GB on PG, 45GB on ClickHouse).
- Speed: Query execution is extremely fast. Most queries on tables with over 1 billion rows run in under 1 second. This is in no small part thanks to its column oriented architecture, which allows queries to be executed in parallel across multiple columns, and also thanks to its distributed architecture which allows it to distribute queries and data across multiple nodes.
- Fast data ingestion
- MergeTree engine family
It was time to move on to implementation. We ran into many challenges — some that we anticipated, and some that we didn't. The rest of this article highlights some of these challenges, and goes into the solutions we found.
The challenge with our data
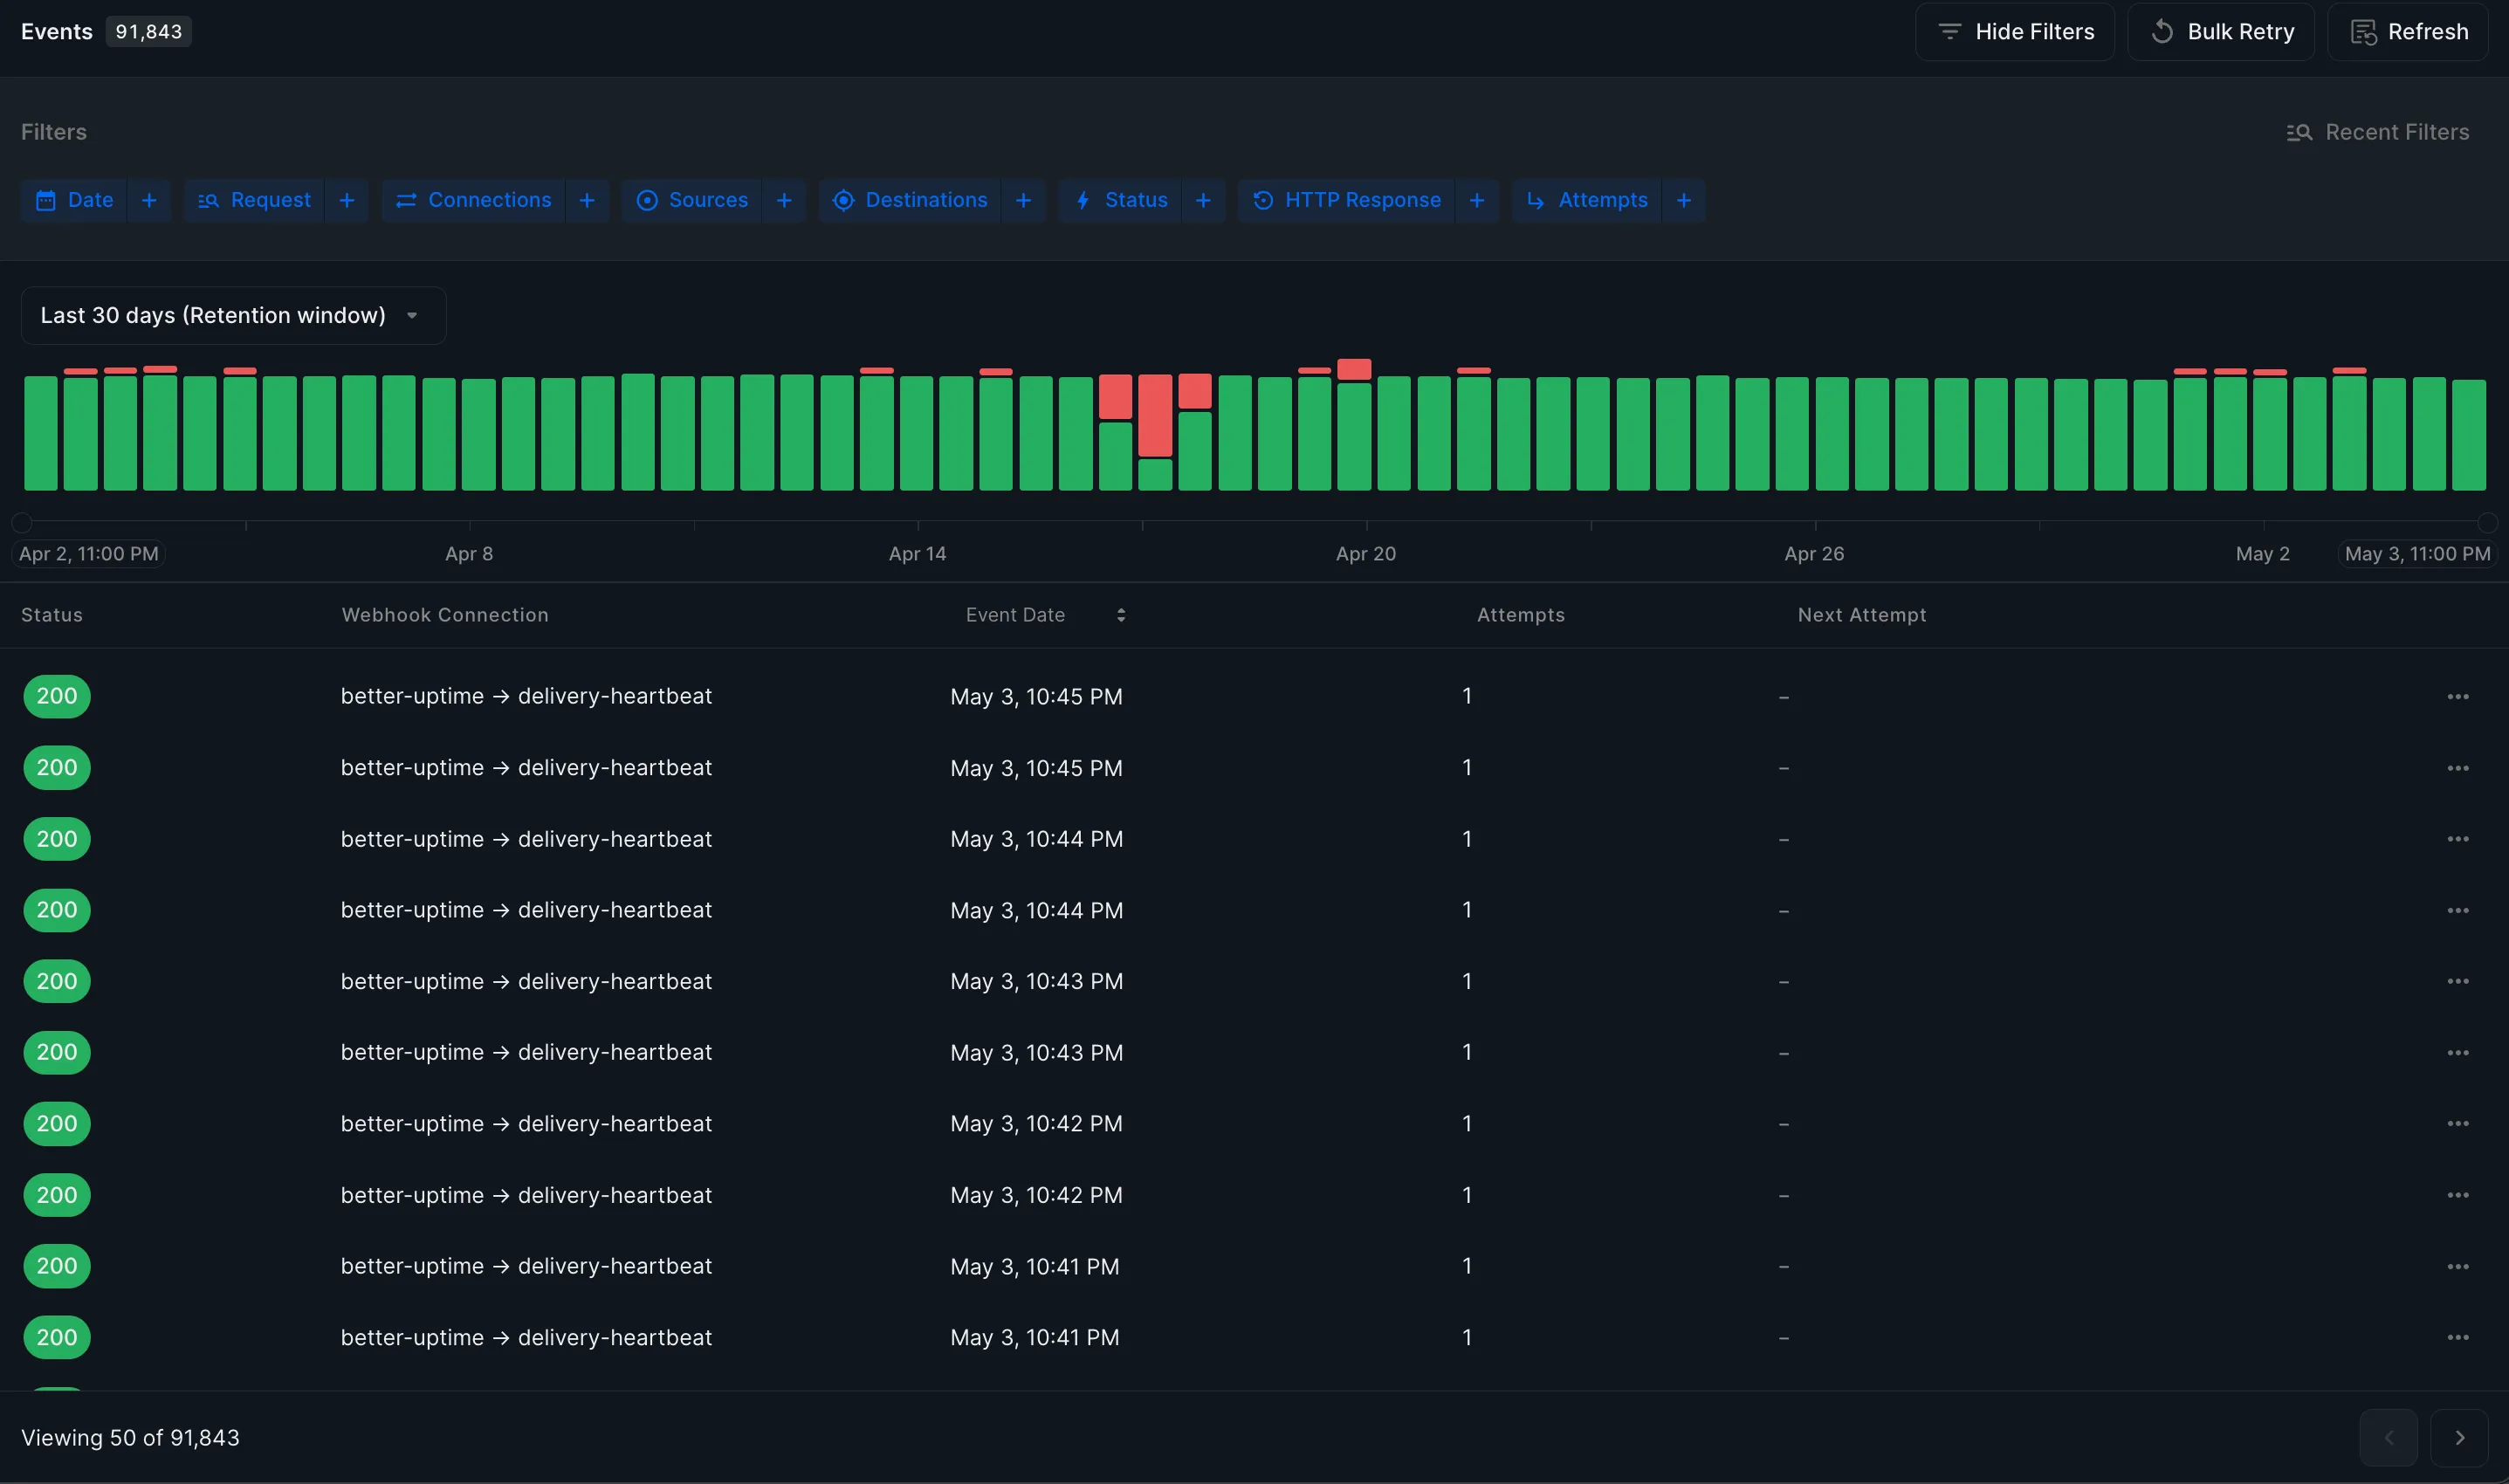
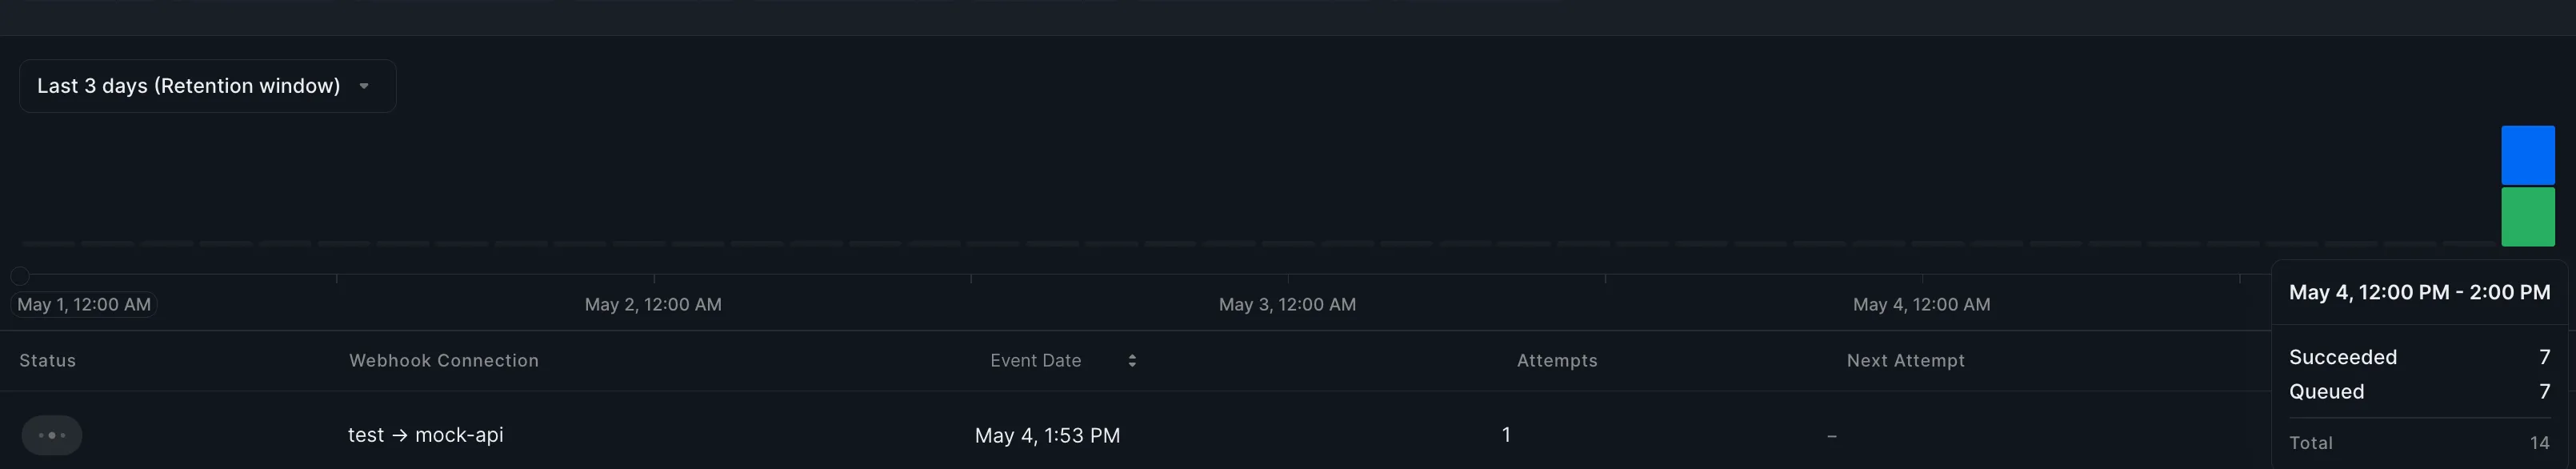
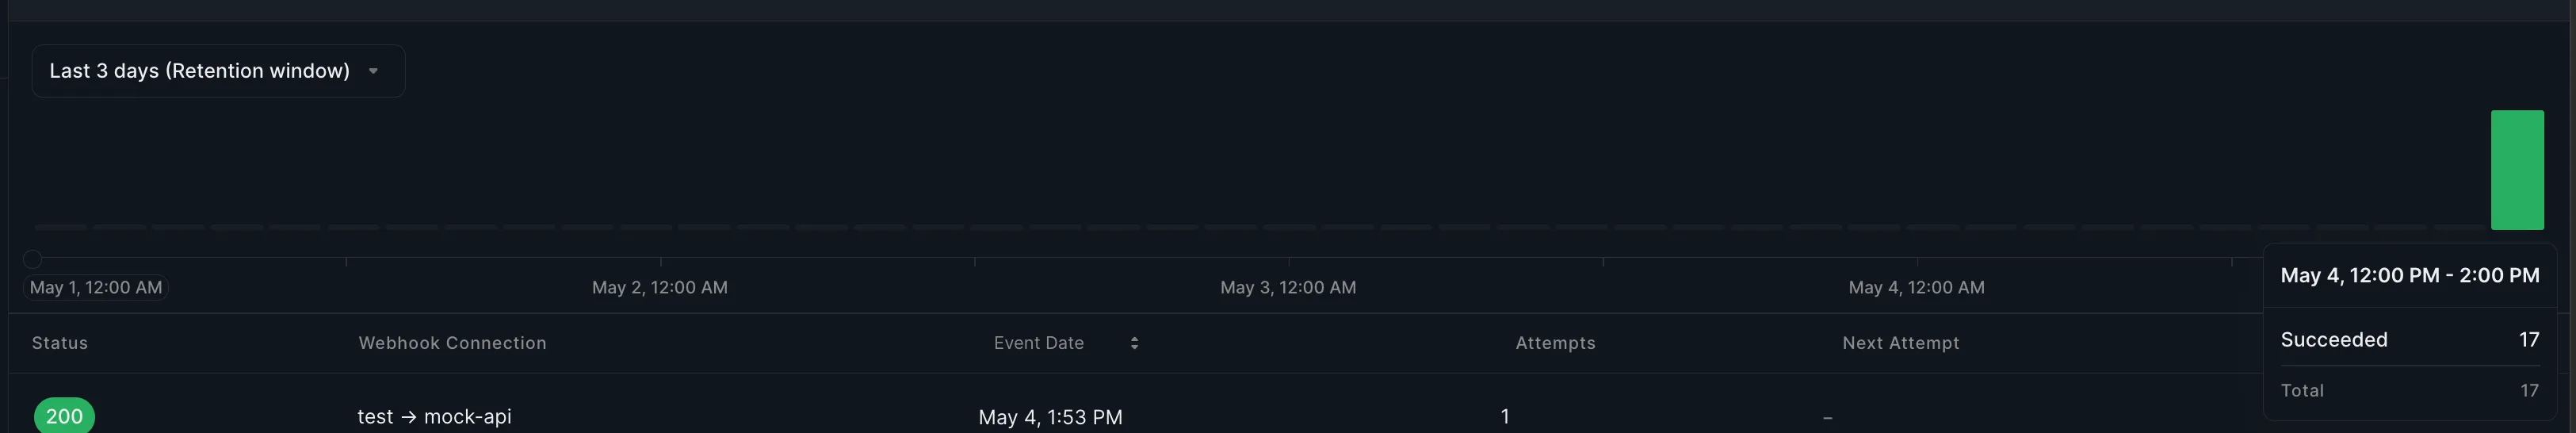
We see Hookdeck as a giant state machine. Events and attempts transition to different states through time. The delivery data we show our users about their webhooks reflects those states. The screenshots below were taken at an interval of a few seconds.
The top histogram shows a few QUEUED events (waiting for delivery), while the one on the bottom shows some of those same events, but with a state of delivered. The time here represents the time at which we received the event, and therefore doesn't change (though we also track the time at which the event was delivered in other views).
With a “normal” data store (i.e. one that supports upserts - inserting, and updating when the row exists, or more generally the ability to update), this data would be easy to fetch since the state in the database is always the most up to date. So we can simply:
SELECT DATE_TRUNC('hour', created_at), count(*)
FROM events
WHERE workspace = 'hookdeck'
GROUP BY 1
ORDER BY 1
ClickHouse is optimized for inserts. While it supports updates in the form of mutations, it should be thought of as an append-only data store. As a matter of fact, avoiding mutations is a best practice. But now we have to reconcile two seemingly incompatible constructs. We need to be able to modify data to represent its new state in a store that doesn't support modifications (spoiler: it’s possible, keep reading).
It's also worth examining what would happen if we only tracked events for every state change, and counted those. Then we wouldn't have the UPDATE problem. We also wouldn't be able to tell how many events have state QUEUED at any given point in time, because the counter for QUEUED events would be incremented every time an event ends up in that state. Therefore, what we'd be counting is how many events transition into a state of QUEUED, but we'd be omitting the number of events that transitioned **out of** that state.
Moving data into ClickHouse
Our transactional event data comes from PostgreSQL. Moving data between stores can be accomplished in different ways, that fall into 2 broad categories:
- Batched (Fivetran, Airbyte)
- Near real time (Kafka)
Since we wanted data to be (almost) immediately available to our customers using our dashboard, we needed to find a near real time solution.
Kafka, Kafka Connect, and Debezium
We already had a pipeline set up with Debezium, as well as PostgreSQL for our CDC (Change Data Capture), so we chose a solution that utilizes the Kafka table engine. Debezium is a collection of connectors available for Kafka Connect, a high-throughput solution for moving data in near real time from a given source into Kafka (source connector), and then from Kafka into a given destination (sink).
While the Kafka table engine solution has some drawbacks (at-least-once delivery causing duplicates, consuming ClickHouse resources to handle data stream, difficult to debug errors, etc.), it is one of the simplest ways to get data from Kafka into ClickHouse.
A ClickHouse connector for Kafka Connect is under development (in beta at the time of writing). This is a particularly exciting development in the space, as it promises an exactly once delivery guarantee, and offloads all processing to Kafka Connect.
Deduplication
But then we had another problem. CDC works by emitting an event for every write operation to a data source, in our case PostgreSQL. Therefore, any INSERT, UPDATE or DELETE gets an event with some sort of configured key, generally the record's primary key.
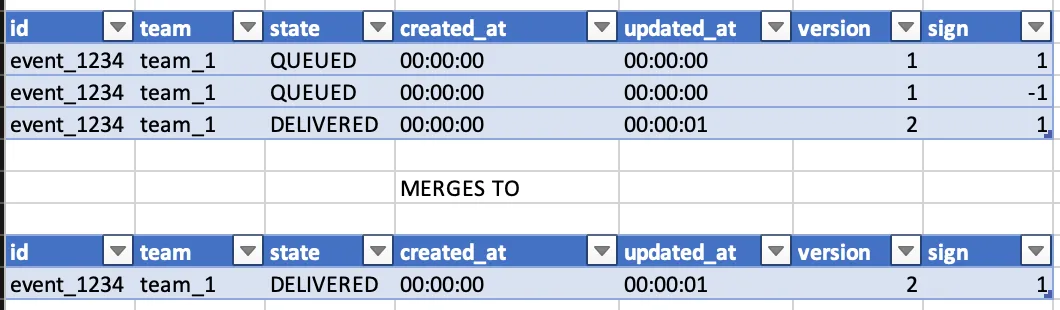
When rows ultimately make it into ClickHouse from Kafka, we get a row for every event state. Therefore, data that looks like this in PostgreSQL…

…will end up looking like this in ClickHouse:
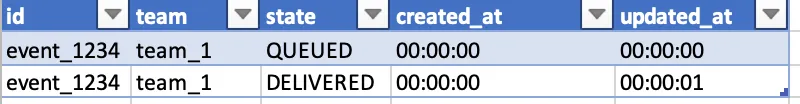
In other words, it had state QUEUED, and then transitioned to DELIVERED.
Primary keys in ClickHouse do not guarantee uniqueness of a given record as many records are allowed for a key. They serve a different purpose.
But ClickHouse features a rich collection of engines called MergeTree, and that ultimately allow us to resolve the duplication problem. While we ended up using most of them, we'll focus on a couple of them for this post.
The basic concept behind these two engines is that they deduplicate data base on a key. The data deduplication, or "merging” to use the correct term, happens indeterministically and asynchronously. One of the main advantages of this is that we only keep the data that we care about - in our case the latest state - and that means less overall data, which in turns leads to less storage and faster queries. However, since the collapsing happens asynchronously (and in some cases may never happen), we're not guaranteed the absence of duplicates when we issue a query. The way around that is to write the queries to account for duplicates in the data set.
Let's talk about a couple of those engines:
- ReplacingMergeTree
ReplacingMergeTree will take a key and a column to use in order to determine the most recent version of a row - the higher the value, the most recent in ClickHouse's eyes. The engine will then periodically merge the table, an operation that consists of removing everything but the most recent row for a given key.
- VersionedCollapsingMergeTree
This engine deduplicates rows based on a column with a UInt8 (usually called a sign column) that takes the value 1 or -1, and a version column, which can be any form of Int. When a new version of a row comes in, it has a sign value of 1 (state row). When an update comes in, it inserts 2 rows: one with the row's key, the previous row's version and a sign of -1 (cancel row), and one with the new version and a sign of 1 (state row).
Then, when a ClickHouse merge occurs (asynchronously), it takes rows with matching keys, versions, and signs 1 and -1, and removes them, leaving only the most recent with sign 1.
Of course the biggest drawback is that one has to generate the cancel rows. However, since we are using Debezium (CDC), it allows us to have both the before and after state of a message for UPDATE operations.
By using a Materialized View on ClickHouse, which acts as an INSERT trigger, we're able to augment the data that comes in from Kafka with the required sign.
There are other useful engines, and picking one is largely dependent on data and queries.
Materialized views
The ability to build streaming data pipelines with ClickHouse makes it a very powerful tool. Let’s say that we’re interested in knowing how many events we receive per hour (total).
One way to go about this is to query our events table:
SELECT toStartOfHour(created_at), sum(sign)
FROM events
GROUP BY 1
We could create a view with that data that we could query directly:
CREATE VIEW events_per_hour AS
SELECT toStartOfHour(created_at), sum(sign)
FROM events
GROUP BY 1
ClickHouse offers another very powerful construct for building such views.
Materialized views act as an insert trigger. They watch some source table, and insert the data in the form that we need it in some target table.
Transforming data sourced from Kafka
Above, we mentioned that we augment data coming from Kafka with a sign column. In ClickHouse, the Kafka table engine is a virtual table that you can read from only once (as the consumer group offset advances in Kafka every time data is read). Reading data from a Kafka table is accomplished with a materialized view - every time a new row is available, it’s read and inserted into a target table.
CREATE TABLE kafka_raw_events (data String)
ENGINE = Mergetree

CREATE MATERILIZED VIEW kafka_raw_events_view TO kafka_raw_events
AS SELECT * FROM kafka_stream
-- kafka_stream is a kafka engine table that reads from a Kafka cluster
-- the stream is configured in our case to read the event's json in raw format
Events that come from Debezium look like:
craete:
{
  before: null,
  after: {
	  id: "event_123",
    attempts: 1
    created_at: ...
    updated_at: '2023-05-05 00:00:00'
  },
  op: "c"
}

update:
{
  before: {
	  id: "event_123",
    attempts: 1
    created_at: ...
    updated_at: '2023-05-05 00:00:00'
  },
  after: {
	  id: "event_123",
    attempts: 2
    created_at: ...
    updated_at: '2023-05-05 00:00:10'
  },
  op: "u"
}
In order to go from this to the collapsing merge tree format, we use a couple of materialized views:
-- Before
CREATE MATERIALIZED VIEW default.events_view_before_json TO default.events
(
    `id` String,
    `attempts` UInt8,
    `version` Int64,
    `sign` Int8
) AS
SELECT
    visitParamExtractString(visitParamExtractRaw(data, 'before'), 'id') AS id,
    visitParamExtractUInt(visitParamExtractRaw(data, 'before'), 'attempts') AS attempts,
    nullIf(visitParamExtractString(visitParamExtractRaw(data, 'before'), 'error_code'), '') AS error_code,
    toUnixTimestamp64Milli(parseDateTime64BestEffort(visitParamExtractString(visitParamExtractRaw(data, 'before'), 'updated_at'), 6)) AS version,
    -1 AS sign
FROM default.kafka_raw_events
WHERE (default.kafka_json_raw.op IN ('u')) AND (default.kafka_json_raw.type = 'events')

-- After
CREATE MATERIALIZED VIEW default.events_view_before_json TO default.events
(
    `id` String,
    `attempts` UInt8,
    `version` Int64,
    `sign` Int8
) AS
SELECT
    visitParamExtractString(visitParamExtractRaw(data, 'after'), 'id') AS id,
    visitParamExtractUInt(visitParamExtractRaw(data, 'after'), 'attempts') AS attempts,
    nullIf(visitParamExtractString(visitParamExtractRaw(data, 'after'), 'error_code'), '') AS error_code,
    toUnixTimestamp64Milli(parseDateTime64BestEffort(visitParamExtractString(visitParamExtractRaw(data, 'after'), 'updated_at'), 6)) AS version,
    -1 AS sign
FROM default.kafka_raw_events
WHERE (default.kafka_json_raw.op IN ('u', 'c')) AND (default.kafka_json_raw.type = 'events')
The 2 materialized views above both insert data into the same table (events), and both read data from the kafka_raw_events table. In other words, when a row is inserted in kafka_raw_events, both views will trigger for that row.
In the case of an update (op = u), we’ll end up with 2 rows - one with sign -1 representing the before state, and one with sign 1, representing the after state. Both will also have the version, which is an integer representation of the updated_at timestamp.
Querying the data from ClickHouse
At this point, we have data in ClickHouse that may or may not have duplicates, and that we’d like to query. Given that fact, we have to account for duplicates in our queries.
Aggregating data
Our histogram views require primarily data aggregation over time along with some filters.
If we were using ReplacingMergeTree, to get the total count of events per hour for team_1 we'd write the following query.
One way to get the status per hour of all events for team_1 on our data would be:
SELECT toStartOfHour(created_at), status, count(*)
FROM (
	SELECT id, team, created_at, status
	FROM events
	WHERE team = 'team_1'
  ORDER BY id, updated_at DESC
  LIMIT 1 BY id, team, created_at
)
GROUP BY 1
The LIMIT 1 BY construct in ClickHouse acts as a DISTINCT where it orders by the ORDER BY clause, but only returns the first row. This works very well when querying a few thousand rows, or even a few hundred thousands. but when we get to the millions, (or 400 million in our case), ClickHouse quickly runs out of memory because it has to aggregate on every single id (high cardinality), when it excels at aggregating on low cardinality (a collection of 4-5 states)
Enter VersionedCollapsingMergeTree. With this engine we're able to rewrite the query as:
SELECT toStartOfHour(created_at), status, sum(sign)
FROM events
WHERE team = 'team_1'
GROUP BY 1, 2
ORDER BY 1
And since the cardinality of the GROUP BY clause is so small, the query runs in under 1 second for our largest workspaces (over 80 million events).
Filters work as well, and so do more complex queries. For instance, we also track the number of attempts (integer on the event table) that an event went through to get delivered. If we wanted to get an idea of the number of attempts per event per hour, in PostgreSQL we’d write something like:
SELECT DATE_TRUNC('hour', created_at), avg(number_of_attempts)
FROM events
WHERE team = 'team_1'
GROUP BY 1
ORDER BY 1
With VersionedCollapsingMergeTree, this becomes:
SELECT toStartOfHour(created_at), sum(sign * number_of_attempts) / sum(sign)
FROM events
WHERE team = 'team_1'
GROUP BY 1
ORDER BY 1
The logic behind this approach is that an older row will be counted, but will also be removed if a newer version is available
As a practical example, in the table below there are 2 events. One (event_1234) with 1 attempt, and one that FAILS on the first attempt, gets re-queued and then redelivered (event_2345) with 2 attempts.
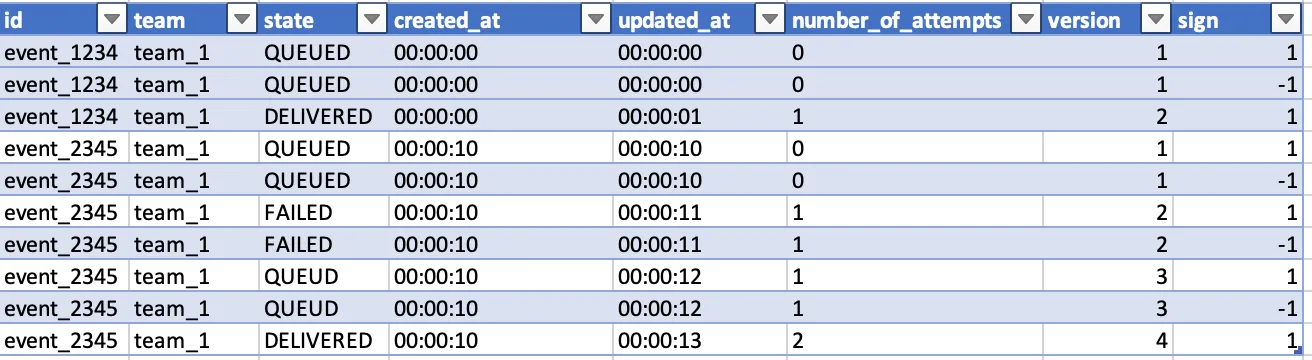
Without duplicate rows, we’d have one event with one attempt and another with 2, which would give us an average per hour of 1.5 attempts ((2+1)/2).
With the above query, we’d end up with:
(1*0+-1*0+1*1)+(1*0+-1*0+1*1+-1*1+1*1+-1*1+1*2) / (1+-1+1+1+-1+1+-1+1+-1+1)
= 3 / 2
= 1.5
Any aggregation is possible, but requires a little more work to avoid situations where stale data is accidentally being counted.
Selecting data
We also load the data for events and request list view from ClickHouse. We ran into a more complex challenge while trying to filter on the latest version of a row in a way where the query still runs in an acceptable amount of time.
We will detail our findings and solutions in another blog post.
Where do we go from here?
When we set out to improve the speed of our read workloads, we set a target of 5 seconds of maximum load time for analytics, and 20 seconds for filters. Our queries are not significantly faster, with an average of 2 seconds across the board.
There are a few areas that we'll continue to invest in:
- Building even more performant tables using materialized views. The beauty of materialized views is that they can be cascaded to derive different, live representations of data. We'll explore more efficient schemas to handle even more complex queries.
- Using the Kafka connector when it becomes available to remove JSON parsing, and AVRO to enforce schemas.
ClickHouse has proven to be a very good choice for our team, even though we felt unsure a few times along the way due to the complexity of some of the queries that we had to build. While that complexity will likely increase as we continue writing analytics-heavy features, I believe that there's an opportunity to abstract much of it, which is something we're working on. ClickHouse has quickly become a favourite at Hookdeck and keeps impressing us with its performance.